Create a Voronoi diagram for a given clustering object.
Usage
voronoi_diagram(
  cluster,
  x,
  y,
  data = NULL,
  show_data = !is.null(data),
  colour_data = TRUE,
  legend = TRUE,
  point_size = 2,
  linewidth = 0.7
)
Arguments
- cluster
an object containing the result of a clustering, e.g., created by
kmeans(). It must contain the fieldsclusterandcenters.- x, y
character giving the names of the variables to be plotted on the x- and y-axis.
- data
The data that has been used to create the clustering. If this is provided, the extension of the plot is adapted to the data and the data points are plotted unless this is suppressed by specifying
show_data = FALSE.- show_data
should the data points be plotted? This is
TRUEby default ifdatais given.- colour_data
should the data points be coloured according to the assigned cluster?
- legend
should a colour legend for the clusters be plotted?
- point_size
numeric indicating the size of the data points and the cluster centres.
- linewidth
numeric indicating the width of the lines that separate the areas for the clusters. Set to 0 to show no lines at all.
Details
The function uses the deldir package to create the polygons for the
Voronoi diagram. The code has been inspired by ggvoronoi, which can
handle more complex situations.
References
Garrett et al., ggvoronoi: Voronoi Diagrams and Heatmaps with ggplot2, Journal of Open Source Software 3(32) (2018) 1096, doi:10.21105/joss.01096
Examples
# \donttest{
cluster <- kmeans(iris[, 1:4], centers = 3)
voronoi_diagram(cluster, "Sepal.Length", "Sepal.Width", iris)
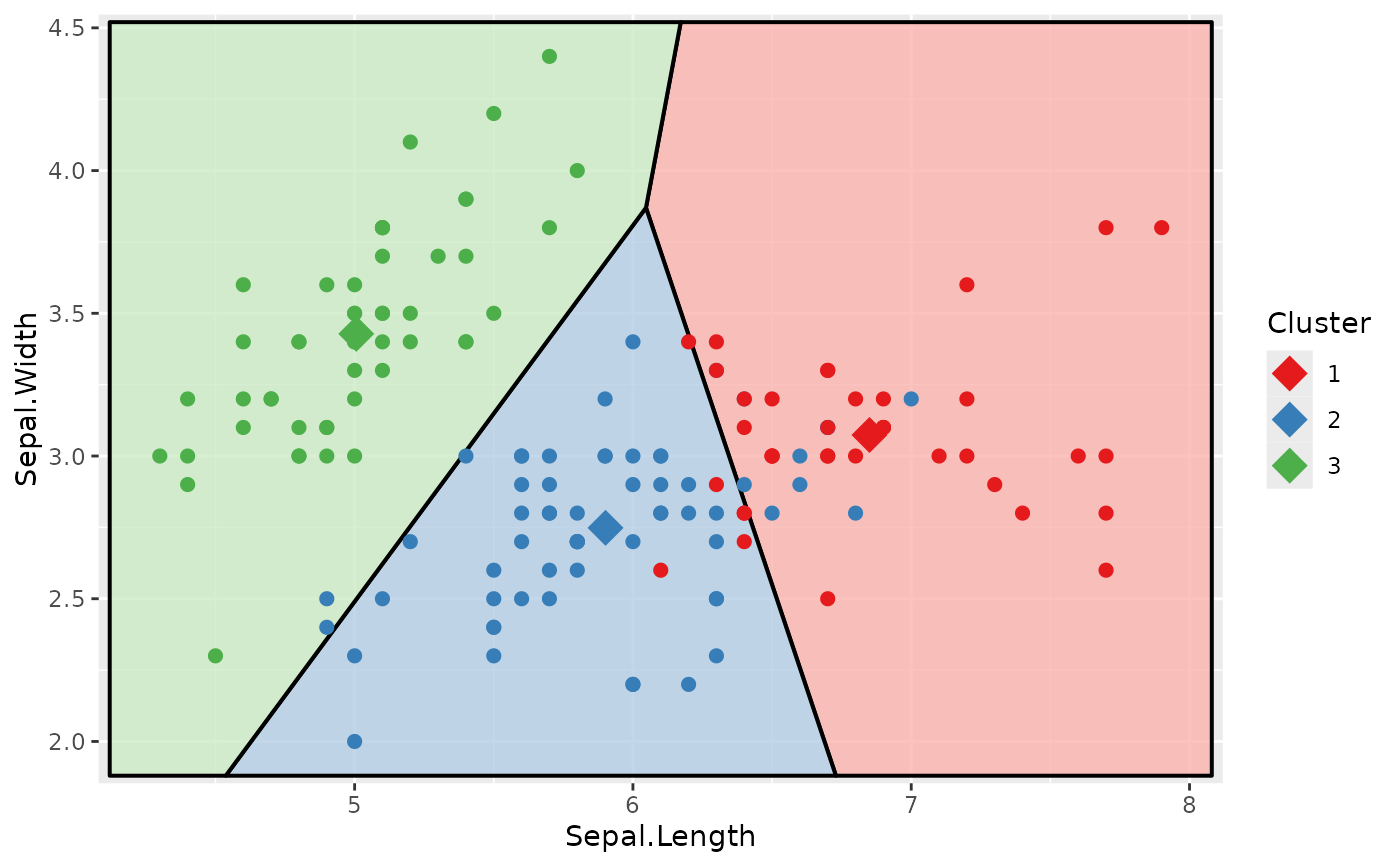 # }
# }